Skeye, CDR, van der Meer Consulting and Deep have jointly initiated the BREAK WATER HEALTH SCAN.
This initiative was developed to offer a single source for determining the health status of breakwaters world-wide by combining above and below water survey techniques with detailed reporting and advice.
To obtain a fully integrated independent insight in the condition or health status of a breakwater, a strong combination of marine engineering expertise, scanning- and visualisation techniques have been combined in this initiative.
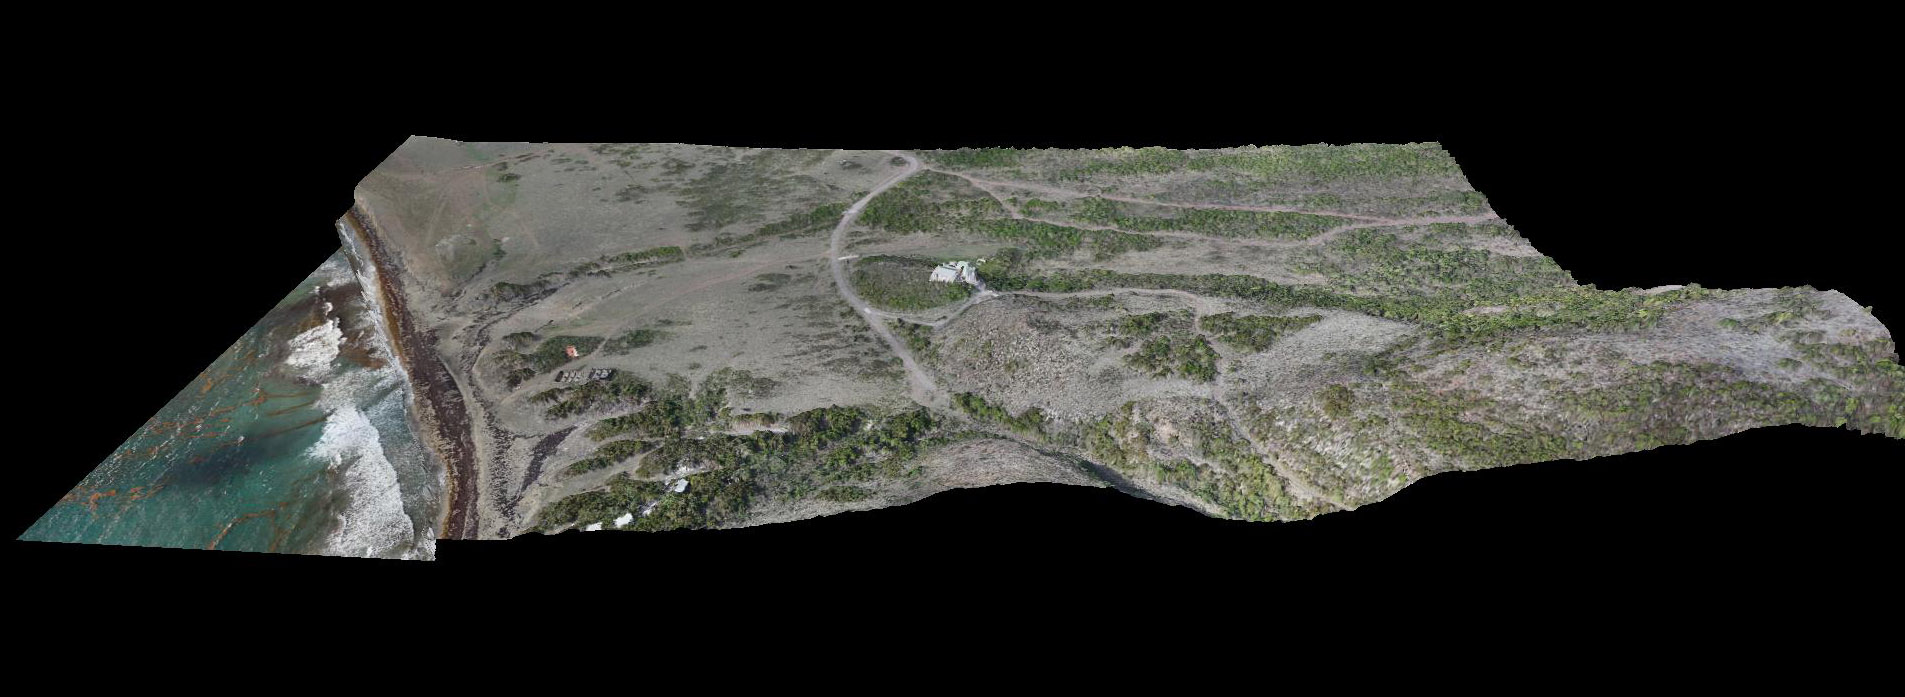
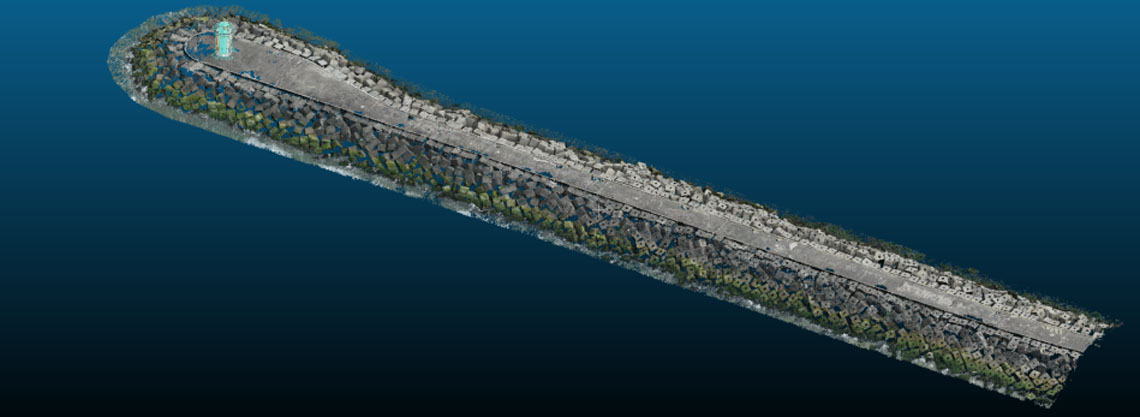
This health scan was recently conducted on the breakwater of the harbour of Scheveningen in the Netherlands. Skeye provided the above water 3D aerial topographic survey using a drone and a combination of photogrammetry and LiDAR. Skeye decided to use these two techniques to understand the accuracies that can be achieved.
For both methods, an Altura Zenith ATX8 drone was used. For the photogrammetry survey the drone was equipped with a 37 Mp full frame camera and flown at a height of 40 meters above ground level with a resulting pixel size of 7 mm.
The LiDAR survey was conducted using the Yellowscan Surveyor unit with a local GNSS base station set up in the project area. Flights were performed at a height of 30 meters in several strips parallel to the breakwater.
For the breakwater health scan, our sister company Deep performed a hydrographic survey under water using multi-beam side scan sonar. The above and below water data sets were integrated to create one uniform 3D dataset. Cross and longitudinal profiles were extracted and compared to the as-build drawings of the breakwater. CDR and van der Meer Consulting then performed the health scan. More information on this health scan can be found on this website.
The LiDAR and photogrammetry data sets were compared and analysed for accuracy. The outcome was positively surprising as higher than expected accuracies were obtained. Usually photogrammetry is geo-referenced using RTK GNSS measurements but the accuracies that were observed during this project were smaller than the typical GNSS accuracy (i.e. 2-3 cm Z accuracy). We then proceeded to use a levelling instrument to resurvey the height of all the ground control and check points.
The 3D digital elevation model from photogrammetry showed an average accuracy of 4 mm in Z with a standard deviation of 5 mm. Under normal circumstances we would have expected this to be 2 to 3 times the pixel size (i.e. 14 to 21mm).
For the LiDAR, the observed Z accuracy versus the levelled heights was 21mm with a standard deviation of 20mm. From an apriori error calculation this was expected to be in the order of 6 cm.